[vc_row][vc_column][vc_single_image source=”featured_image” img_size=”full” alignment=”center”][vc_column_text]Where technology is present in our daily lives, sensors translate the physical world into the language of electrons and data. They are the critical components that perceive, empowering artificial intelligence to make informed decisions at the edge of innovation.
What Exactly Is a Sensor?
A sensor is an electronic device that measures physical properties like temperature, heart rate, or humidity, and converts them into signals that an observer or an instrument reads. From simple switches to complex thermal imaging cameras, sensors form the backbone of our smart devices, making sense of the world.
Yet, when it comes to distinguishing one’s voice amidst noise, sensors need more than just raw data—they need intelligence. This is where concepts like the Fourier transform come into play, breaking down complex signals into their frequency components.
The Fourier Transform and Signal Processing
The Fourier Transform is in many technologies we use, but let’s consider its role in a spectrum or frequency analyzer.
For those unfamiliar with how it works, let’s simplify it: envision the process of converting sound into electrical signals. Your audio signal, the red waveform, is a mix of multiple signals (the sum of the blue, green, and purple waves), each with a different frequency. Each frequency signifies the number of complete cycles within a specific time period, what we call the wave frequency. The Fourier Transform takes advantage of this to shift the signal from the time domain to the frequency domain.
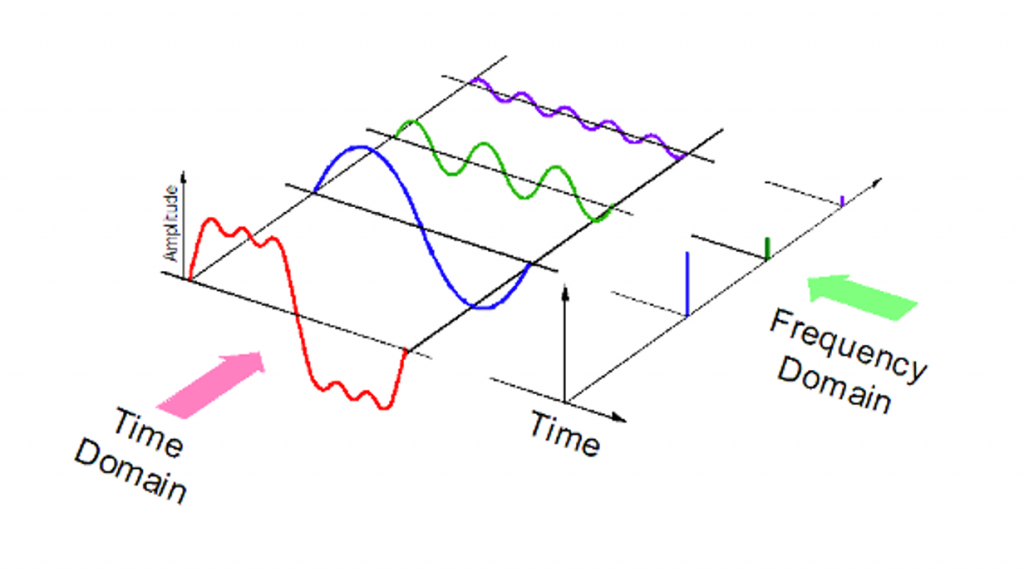 Imagine having a set of signals at different frequencies and using the Fourier Transform to decompose your audio signal into these individual frequencies. This allows you to analyze and process each frequency component separately, enabling more efficient and rapid application of filters and other signal processing techniques.
Delving into the Sensory World Supporting Edge Devices
Sensors provide data in various formats, essential for edge AI applications. Let’s break down the common data types:
Time Series Data: Measuring the Pulse of Change
A time series is like a diary, tracking changes in values over time. Data from physical sensors—recording temperature, humidity, and other phenomena—samples typically at a specific rate. Although some sensors, like proximity detectors, capture data irregularly, time series data is vital for AI on the edge, and provides both sensor values and measurement timestamps. This temporal information is key to understanding how situations evolve.
For edge AI, especially on resource-limited devices, using time series data alongside a Real-Time Clock (RTC) is crucial for accurate timekeeping. The RTC stamps each measurement, crucial for syncing and analyzing data and implementing time-based predictive models and machine learning.
The sampling rate of time series data can vary greatly depending on the sensor, which must be considered when choosing the appropriate rate for the application.
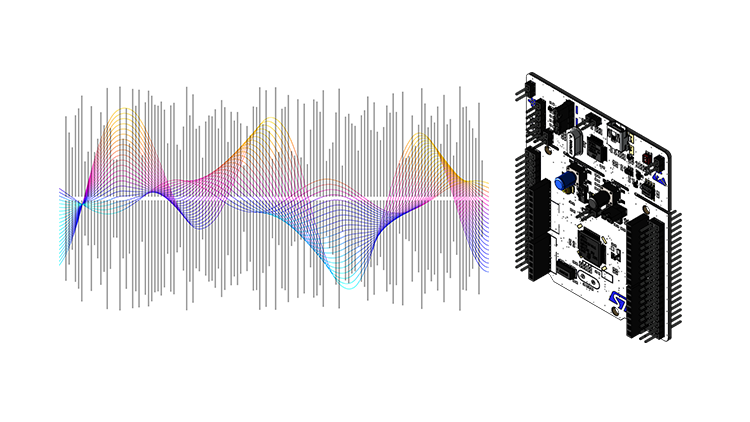
Audio Data: Capturing the Invisible
Audio data, a unique type of time series data, captures sound wave oscillations at high frequencies. Much research has gone into innovations for working with audio data on edge devices. These devices can apply filters and use libraries like CMSIS for DSP, enhancing their capabilities.
The processing of audio signals is common, and many integrated devices have built-in functionalities for this. However, audio data isn’t confined to human-audible sounds—systems like Alexa also capture ultrasonic (above human hearing) and infrasonic (below human hearing) data, often using I2S sensor arrays.
Image Data: A Pixelated World
Images are like a grid of pixels, each pixel being a programmable unit of color on a computer screen. Composed of red, green, and blue subpixels, they collectively form the visible spectrum on a display.

The typical n-dimensional grid representation of images means they contain spatial information about the proximity of different elements in a scene—information that’s extremely valuable for understanding scene contents and used by entire classes of image processing and computer vision algorithms.
Also, images aren’t limited to visible light they may also represent infrared (used for temperature measurement), time-of-flight data, or even radio waves.
For a demonstration of how advanced sensors like LiDAR work, here’s a video showcasing their functionality.
[/vc_column_text][/vc_column][/vc_row][vc_row][vc_column][/vc_column][/vc_row]